
Stop Guessing: The 9 Essential Website KPIs to Track for Explosive Business Growth by 2026
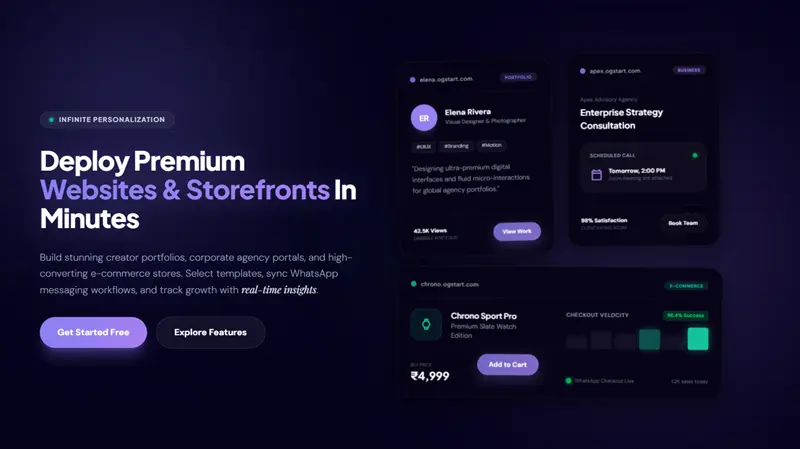
Starting an online business is an exhilarating journey, fraught with passion, innovation, and sometimes, a little bit of guesswork. At OGStart.com, we believe that launching your dream project, whether it’s an e-commerce store, a professional portfolio, or a business website, should be accessible and affordable, beginning at just Rs. 99. We handle the complexities of hosting, infrastructure, and website management, empowering you to focus on what truly matters: your business. But once your digital storefront is live, how do you move beyond hope and intuition to ensure explosive growth? The answer lies in data – specifically, in tracking the right Key Performance Indicators (KPIs).
We systematically analyzed the landscape of online business growth and identified that successful entrepreneurs don't just launch; they learn, adapt, and optimize based on clear, quantifiable metrics. Guesswork leads to stagnation, but strategic tracking of website KPIs illuminates the path to sustained success. By 2026, the digital marketplace will be even more competitive, making data-driven decision-making not just an advantage, but a necessity.
This comprehensive guide, informed by over a decade of experience in SEO and content strategy, will demystify the nine essential website KPIs every aspiring and growing business owner on a platform like OGStart needs to monitor. We will explain what each KPI means, why it’s crucial for your specific business type, and how you can leverage these insights to make informed decisions and foster genuine growth.
What Are Website KPIs and Why Do They Matter for Your Growing Business?
A Key Performance Indicator (KPI) is a measurable value that demonstrates how effectively a company is achieving key business objectives. In the context of your website, KPIs are the vital signs that tell you if your online presence is healthy, engaging, and contributing to your bottom line. They transform abstract goals into concrete, actionable numbers.
Beyond Vanity Metrics: True Indicators of Growth
It's easy to get caught up in "vanity metrics" – numbers that look good on paper but don't necessarily correlate with business success. For example, a high number of social media followers might seem impressive, but if those followers never visit your website or make a purchase, that metric has limited business value. We understand the temptation to focus on easily accessible numbers, but true growth comes from understanding what those numbers actually mean for your objectives.
According to a guide for small business owners, KPIs are essential because they provide a foolproof management system, helping businesses avoid the high failure rates often seen in the first few years. Without clear KPIs, small businesses risk unclear objectives and managerial dysfunction. KPIs are not just numbers; they are powerful tools that enable you to make smarter, data-backed decisions that drive you towards your strategic goals.
The OGStart Philosophy: Start Small, Track Smart
At OGStart, we empower you to launch your business online for as little as Rs. 99, allowing you to validate your ideas affordably. Our platform handles the complex hosting, infrastructure, and ongoing website management, freeing you from technical worries. This means you can devote your precious time and resources to understanding your customers and optimizing your business based on real data.
Our philosophy is simple: start small, launch fast, and upgrade only when your business grows. Tracking the right KPIs from day one aligns perfectly with this approach. By understanding your website's performance, you can identify what's working, what isn't, and where to invest your next effort, ensuring that every step you take is a smart one, not a guess.
The 9 Essential Website KPIs for Explosive Business Growth
We have carefully selected these nine KPIs because they provide a holistic view of your website's performance, covering everything from user acquisition and engagement to conversion and long-term customer value. For businesses built on the OGStart platform – be it an e-commerce store, a portfolio site, or a lead-generation business – these metrics are universally applicable and profoundly insightful.
1. Website Traffic: Knowing Who's Knocking
Website traffic refers to the total number of visits and unique visitors your website receives over a specific period. It’s the foundational metric that tells you if people are finding your online presence. While it can be a vanity metric on its own, understanding traffic sources and visitor behavior turns it into an actionable KPI.
- Total Visits (Sessions): The total number of times users visit your website.
- Unique Visitors: The number of individual people who visit your site. One unique visitor can have multiple sessions.
- Traffic Sources: Where your visitors are coming from (e.g., organic search, social media, direct, referral, paid ads).
Why it matters: High traffic indicates brand awareness and potential interest. Analyzing traffic sources helps you understand which marketing channels are most effective. For an OGStart user, seeing an increase in traffic means your initial efforts in content creation, SEO, or social media outreach are paying off, bringing potential customers to your affordable online store or portfolio.
2. Conversion Rate: Turning Visitors into Customers
The conversion rate is arguably the most critical KPI, especially for e-commerce stores and lead-generation websites. It measures the percentage of website visitors who complete a desired action, known as a "conversion." This action could be a purchase, a form submission, a newsletter signup, or a download.
Calculation: (Number of Conversions / Number of Website Visitors) * 100.
Why it matters: A high conversion rate means your website is effective at persuading visitors to take the next step. For e-commerce businesses, an average conversion rate often hovers around 2% to 3%, but this can vary significantly by industry and channel. Tracking this KPI tells you if your product descriptions, calls to action, or user experience need improvement. OGStart’s streamlined templates and reliable performance are designed to help you optimize for conversions by providing a stable and easy-to-navigate platform.
3. Bounce Rate: Keeping Visitors Engaged
Bounce rate is the percentage of visitors who land on your website and leave without interacting further or navigating to other pages. They "bounce" back to where they came from.
Why it matters: A high bounce rate (e.g., over 70-80% for content sites, lower for e-commerce) can indicate several issues: irrelevant content, slow loading times, poor mobile experience, or an unclear call to action. Conversely, a low bounce rate suggests that visitors are finding your content engaging and relevant, prompting them to explore more of your site. OGStart ensures fast loading speeds and mobile responsiveness, laying a strong foundation for reducing bounce rates.
4. Average Session Duration: How Long Are They Staying?
Average session duration measures the average amount of time visitors spend on your website during a single visit. This metric provides insight into how engaged users are with your content and offerings.
Why it matters: Longer session durations generally indicate higher engagement. If users are spending more time on your product pages, reading your blog posts, or exploring your portfolio, it suggests they are interested in what you offer. This is a crucial indicator for content-heavy sites and portfolios, showing whether your stories and visuals are captivating your audience.
5. Pages Per Session: Deeper Dives into Your Content
Pages per session measures the average number of pages a user views during a single visit to your website. It’s another excellent indicator of user engagement and website structure effectiveness.
Why it matters: A higher number of pages per session means users are delving deeper into your website, exploring multiple products, services, or pieces of content. This suggests good internal linking, intuitive navigation, and compelling content that encourages further exploration. For an e-commerce store, this could mean users are browsing various product categories, indicating strong interest and potential for conversion.
6. Customer Acquisition Cost (CAC): The Price of Growth
Customer Acquisition Cost (CAC) is the total cost involved in convincing a potential customer to buy a product or service. It includes all marketing, sales, and promotional expenses incurred to acquire a new customer.
Calculation: (Total Sales & Marketing Spend / Number of New Customers Acquired)
Why it matters: For any growing business, understanding CAC is vital for profitability and sustainable growth. If your CAC is higher than the revenue you generate from a customer, your business model is unsustainable. By tracking CAC, OGStart users can optimize their marketing spend, ensuring that their affordable launch leads to cost-effective customer acquisition. This metric is especially important when you start scaling your marketing efforts.
7. Customer Lifetime Value (CLTV): Long-Term Relationships, Long-Term Profit
Customer Lifetime Value (CLTV), also known as LTV, predicts the total revenue a business can reasonably expect from a single customer account throughout their entire relationship with the company.
Why it matters: CLTV helps you understand the long-term profitability of your customer relationships. A high CLTV indicates strong customer loyalty and repeat business, which is far more cost-effective than constantly acquiring new customers. When compared against CAC, CLTV provides a clear picture of your business's health and potential for sustained growth. For OGStart users, focusing on CLTV helps you decide how much to invest in customer retention strategies like email marketing or loyalty programs.
8. Return on Ad Spend (ROAS): Getting More for Your Marketing Buck
Return on Ad Spend (ROAS) is a marketing metric that measures the amount of revenue earned for each unit of currency spent on advertising. It helps evaluate the effectiveness of your advertising campaigns.
Calculation: (Revenue from Ad Campaign / Cost of Ad Campaign) * 100
Why it matters: If you're leveraging paid advertising (social media ads, search engine marketing) to drive traffic to your OGStart-powered website, ROAS is indispensable. It tells you directly which campaigns are profitable and which need optimization or discontinuation. A strong ROAS ensures your marketing budget, whether small or growing, is being utilized efficiently to generate revenue.
9. Lead-to-Close Ratio: From Prospect to Paying Client
The Lead-to-Close Ratio (or Sales Conversion Rate) measures the percentage of leads that successfully convert into paying customers. This KPI is particularly relevant for service-based businesses, B2B companies, or any business with a sales funnel that involves qualifying leads before a final transaction.
Calculation: (Number of Closed Deals / Number of Qualified Leads) * 100
Why it matters: This metric gauges the efficiency of your sales process and the quality of your leads. A low ratio might indicate that your marketing efforts are attracting unqualified leads, or that your sales process needs refinement. For freelancers showcasing their portfolio on OGStart, a high lead-to-close ratio means your work is resonating and your proposals are effective in securing new projects. For a comprehensive understanding of sales performance, measuring this efficiency is crucial, as highlighted in a Harvard Business Review article on sales team metrics.
How to Track Your Essential KPIs Effectively
Tracking these KPIs doesn't require complex, expensive software. Most can be monitored using readily available and often free tools. The key is consistency and understanding what the numbers are telling you.
Choosing the Right Tools
For most website KPIs, especially those related to traffic and user behavior, tools like Google Analytics (GA4) are invaluable. They offer comprehensive data on visitors, their journey through your site, conversions, and more. For e-commerce platforms, built-in analytics often provide sales, conversion, and product performance metrics. For paid ad campaigns, each platform (Google Ads, Facebook Ads) provides detailed ROAS and CAC data.
Since OGStart handles the technical backend, integrating these tracking tools is straightforward. You can easily connect your website to Google Analytics, allowing you to focus on analyzing the data rather than worrying about server uptime or platform compatibility.
Setting Up Your Measurement Framework
We advocate for a structured approach to KPI tracking. Here's a simple framework:
- Define Your Goals: What do you want your website to achieve? (e.g., "Increase online sales by 20%," "Generate 10 leads per week").
- Select Relevant KPIs: Choose 3-5 KPIs directly aligned with your goals. Don't try to track everything at once.
- Set Benchmarks: What's a good performance? Research industry averages or track your own historical data.
- Implement Tracking: Install Google Analytics, connect e-commerce analytics, etc.
- Regularly Review: Schedule weekly or monthly check-ins to review your KPIs.
- Take Action: Based on your findings, make adjustments to your website, content, or marketing strategies. Then, measure again.
By consistently following this cycle, you transform raw data into actionable insights, driving continuous improvement and growth for your business.
| Category | Vanity Metrics (Less Actionable) | Actionable KPIs (More Impactful) |
|---|---|---|
| Traffic | Total Website Hits | Unique Visitors, Traffic Sources |
| Engagement | Total Page Views | Average Session Duration, Pages Per Session, Bounce Rate |
| Conversions | Number of New Leads | Conversion Rate, Lead-to-Close Ratio |
| Financial | Total Revenue | Customer Acquisition Cost (CAC), Customer Lifetime Value (CLTV), Return on Ad Spend (ROAS) |
Leveraging OGStart for Data-Driven Growth
Your journey with OGStart begins with an incredibly affordable foundation, freeing you from the typical high upfront costs associated with launching an online business. This cost-effectiveness isn't just about saving money; it's about shifting your focus from infrastructure woes to strategic growth based on data.
Affordable Foundations for Data-Driven Growth
When you launch your website or online store for Rs. 99 with OGStart, you're not just getting a basic online presence. You're gaining a robust, scalable platform where you can easily integrate tools like Google Analytics. We handle the heavy lifting – the hosting, platform updates, security, and technical scaling – so you, as a first-time founder, an Instagram seller, or a freelancer, can dedicate your energy to understanding your customers and optimizing your website using the KPIs we've discussed.
This allows you to test new business ideas, validate products, and refine your marketing strategies without the financial pressure of a large initial investment. You bring your own domain, and we provide the reliable, high-performance engine beneath it, ready to connect with your chosen analytics platforms.
Scaling Smartly with OGStart
The beauty of OGStart lies in its "upgrade only when your business grows" model. As you meticulously track your KPIs and identify areas of opportunity or success, you'll naturally grow. Perhaps your conversion rate skyrockets, leading to more sales. Or your CLTV indicates a need for more advanced e-commerce features. With OGStart, you won't be paying for enterprise-level features on day one when you don't need them. Instead, your platform scales with your data-driven growth, ensuring that your investment is always proportionate to your business's success.
This strategic alignment between an affordable, powerful platform and a data-first approach creates a potent combination for explosive business growth. You're not guessing your way to success; you're building it systematically, one KPI insight at a time.
Conclusion
In the dynamic world of online business, relying on intuition alone is a recipe for stagnation. To achieve explosive business growth by 2026, you must embrace a data-driven mindset, actively tracking and analyzing the right website KPIs. From understanding who visits your site and how long they stay, to converting them into loyal, high-value customers, each of the nine essential KPIs we've explored offers a critical piece of the puzzle.
At OGStart, we are committed to empowering entrepreneurs like you to launch fast, validate ideas affordably, and grow smart. By providing a reliable, cost-effective platform that manages the technical complexities, we free you to become a savvy business owner who leverages data, not guesswork, to steer your online venture towards unparalleled success. Don't just launch your business; launch it with the intelligence to conquer the digital frontier. Start your data-driven journey with OGStart today and build the future of your business, one informed decision at a time.